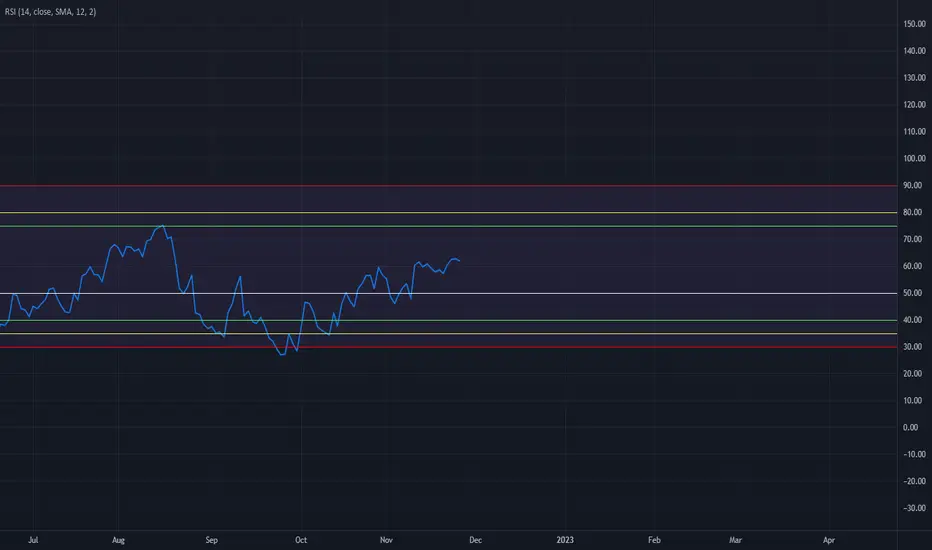
Volume RSIRelative strength index based on volume data.
Indicate volume momentum, and help you define divergences on volume.
The goal is to have an idea and represent in another form volumes and kept eyes on volume momentum on a certain period.
RSI is an indicator about the strength, I keep the oversold/overbought thresholds. I think it still makes sense to interpret.
the calculations is simple, we use the average volume up (avg_vol_up) and average volume down (avg_vol_down) over the period.
then calculate the relatives strength : ( avg_vol_up / ( avg_vol_up + avg_vol_down ) ) * 100
The period is 14 by default. The period is used for calculating mean.
I also add MA it helps to have a global look on the indicator.
In my code I used the idea of @Padronhosnai in his code "positve/negative volume" to get volumes in the right form.
For pictures I also use his indicator it's the one above.
Cerca negli script per "relative strength"

Relative Strength Comparison_FBMSCAPShows the strength of current symbol relative to strength of another symbol, defaulted to Bursa Malaysia broad market index: FBMSCAP. Best viewed in weekly chart.

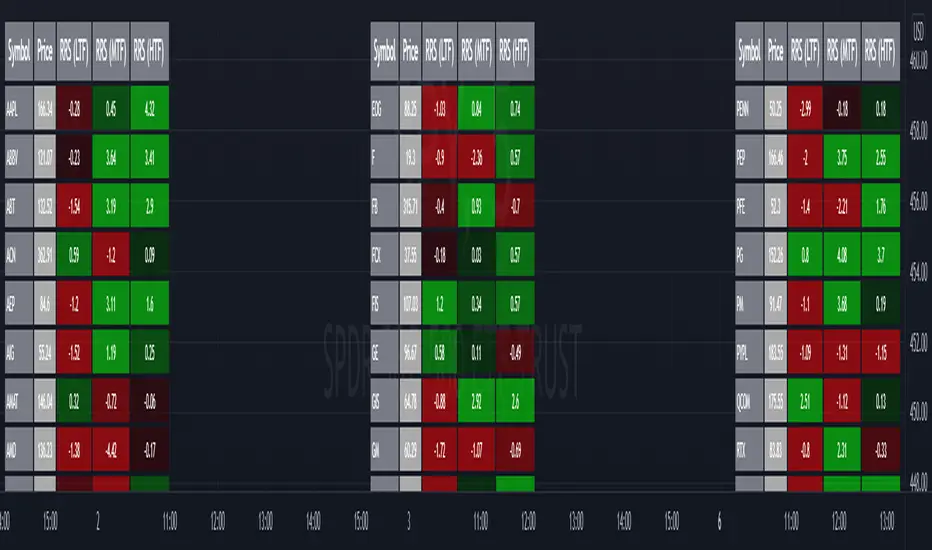
Relative Strength Screener V2 - Top 100 volume leadersNew and improved strength heatmap for the top 100 volume leaders in the S&P. Coded in a workaround to the 40 request.security limitation that currently exists in Pine. Added the ability to input the number of columns (time frames) you wish to display.
For 3 time frame analysis, add the indicator to your chart 3 times. Change the number of columns to 3 for each of these indicators. Specify the column and time frame for each one (example, 5 minute for column 1, 1 hour for column 2 and Daily chart for column 3). It will automatically resize the columns/tables to properly display the output. This provides a sort of "Strength Heatmap" for the top 100 stocks in the S&P. To achieve this, make a copy of the indicator and substitute lines 68-105 with the following premade watchlists :
Make a copy 1 - FIrst 38 volume leaders in the S&P
s01 = input.symbol('AAPL', group = 'Symbols', inline = 's01')
s02 = input.symbol('ABBV', group = 'Symbols', inline = 's02')
s03 = input.symbol('ABT', group = 'Symbols', inline = 's03')
s04 = input.symbol('ACN', group = 'Symbols', inline = 's04')
s05 = input.symbol('AEP', group = 'Symbols', inline = 's05')
s06 = input.symbol('AIG', group = 'Symbols', inline = 's06')
s07 = input.symbol('AMAT', group = 'Symbols', inline = 's07')
s08 = input.symbol('AMD', group = 'Symbols', inline = 's08')
s09 = input.symbol('APA', group = 'Symbols', inline = 's09')
s10 = input.symbol('ATVI', group = 'Symbols', inline = 's10')
s11 = input.symbol('AXP', group = 'Symbols', inline = 's11')
s12 = input.symbol('BA', group = 'Symbols', inline = 's12')
s13 = input.symbol('BBWI', group = 'Symbols', inline = 's13')
s14 = input.symbol('BBY', group = 'Symbols', inline = 's14')
s15 = input.symbol('BK', group = 'Symbols', inline = 's15')
s16 = input.symbol('BMY', group = 'Symbols', inline = 's16')
s17 = input.symbol('BRK.B', group = 'Symbols', inline = 's17')
s18 = input.symbol('C', group = 'Symbols', inline = 's18')
s19 = input.symbol('CAT', group = 'Symbols', inline = 's19')
s20 = input.symbol('CCL', group = 'Symbols', inline = 's20')
s21 = input.symbol('CFG', group = 'Symbols', inline = 's21')
s22 = input.symbol('CL', group = 'Symbols', inline = 's22')
s23 = input.symbol('CNC', group = 'Symbols', inline = 's23')
s24 = input.symbol('COF', group = 'Symbols', inline = 's24')
s25 = input.symbol('COP', group = 'Symbols', inline = 's25')
s26 = input.symbol('COST', group = 'Symbols', inline = 's26')
s27 = input.symbol('CRM', group = 'Symbols', inline = 's27')
s28 = input.symbol('CVS', group = 'Symbols', inline = 's28')
s29 = input.symbol('CVX', group = 'Symbols', inline = 's29')
s30 = input.symbol('DAL', group = 'Symbols', inline = 's30')
s31 = input.symbol('DIS', group = 'Symbols', inline = 's31')
s32 = input.symbol('DISCA', group = 'Symbols', inline = 's32')
s33 = input.symbol('DISCK', group = 'Symbols', inline = 's33')
s34 = input.symbol('DISH', group = 'Symbols', inline = 's34')
s35 = input.symbol('DLTR', group = 'Symbols', inline = 's35')
s36 = input.symbol('DOW', group = 'Symbols', inline = 's36')
s37 = input.symbol('DVN', group = 'Symbols', inline = 's37')
s38 = input.symbol('EBAY', group = 'Symbols', inline = 's38')
Make a copy 2 - Tickers 39 to 76
s01 = input.symbol('EOG', group = 'Symbols', inline = 's01')
s02 = input.symbol('F', group = 'Symbols', inline = 's02')
s03 = input.symbol('FB', group = 'Symbols', inline = 's03')
s04 = input.symbol('FCX', group = 'Symbols', inline = 's04')
s05 = input.symbol('FIS', group = 'Symbols', inline = 's05')
s06 = input.symbol('GE', group = 'Symbols', inline = 's06')
s07 = input.symbol('GIS', group = 'Symbols', inline = 's07')
s08 = input.symbol('GM', group = 'Symbols', inline = 's08')
s09 = input.symbol('GS', group = 'Symbols', inline = 's09')
s10 = input.symbol('HD', group = 'Symbols', inline = 's10')
s11 = input.symbol('IBM', group = 'Symbols', inline = 's11')
s12 = input.symbol('INTC', group = 'Symbols', inline = 's12')
s13 = input.symbol('JNJ', group = 'Symbols', inline = 's13')
s14 = input.symbol('JPM', group = 'Symbols', inline = 's14')
s15 = input.symbol('KR', group = 'Symbols', inline = 's15')
s16 = input.symbol('LUV', group = 'Symbols', inline = 's16')
s17 = input.symbol('LVS', group = 'Symbols', inline = 's17')
s18 = input.symbol('MA', group = 'Symbols', inline = 's18')
s19 = input.symbol('MCD', group = 'Symbols', inline = 's19')
s20 = input.symbol('MCHP', group = 'Symbols', inline = 's20')
s21 = input.symbol('MDT', group = 'Symbols', inline = 's21')
s22 = input.symbol('MET', group = 'Symbols', inline = 's22')
s23 = input.symbol('MGM', group = 'Symbols', inline = 's23')
s24 = input.symbol('MOS', group = 'Symbols', inline = 's24')
s25 = input.symbol('MPC', group = 'Symbols', inline = 's25')
s26 = input.symbol('MRK', group = 'Symbols', inline = 's26')
s27 = input.symbol('MRNA', group = 'Symbols', inline = 's27')
s28 = input.symbol('MS', group = 'Symbols', inline = 's28')
s29 = input.symbol('MSFT', group = 'Symbols', inline = 's29')
s30 = input.symbol('MU', group = 'Symbols', inline = 's30')
s31 = input.symbol('NCLH', group = 'Symbols', inline = 's31')
s32 = input.symbol('NEE', group = 'Symbols', inline = 's32')
s33 = input.symbol('NEM', group = 'Symbols', inline = 's33')
s34 = input.symbol('NFLX', group = 'Symbols', inline = 's34')
s35 = input.symbol('NKE', group = 'Symbols', inline = 's35')
s36 = input.symbol('NVDA', group = 'Symbols', inline = 's36')
s37 = input.symbol('ORCL', group = 'Symbols', inline = 's37')
s38 = input.symbol('OXY', group = 'Symbols', inline = 's38')
Make a copy 3 - tickers 77 to 114
s01 = input.symbol('PENN', group = 'Symbols', inline = 's01')
s02 = input.symbol('PEP', group = 'Symbols', inline = 's02')
s03 = input.symbol('PFE', group = 'Symbols', inline = 's03')
s04 = input.symbol('PG', group = 'Symbols', inline = 's04')
s05 = input.symbol('PM', group = 'Symbols', inline = 's05')
s06 = input.symbol('PYPL', group = 'Symbols', inline = 's06')
s07 = input.symbol('QCOM', group = 'Symbols', inline = 's07')
s08 = input.symbol('RTX', group = 'Symbols', inline = 's08')
s09 = input.symbol('SBUX', group = 'Symbols', inline = 's09')
s10 = input.symbol('SCHW', group = 'Symbols', inline = 's10')
s11 = input.symbol('SLB', group = 'Symbols', inline = 's11')
s12 = input.symbol('SYF', group = 'Symbols', inline = 's12')
s13 = input.symbol('T', group = 'Symbols', inline = 's13')
s14 = input.symbol('TFC', group = 'Symbols', inline = 's14')
s15 = input.symbol('TGT', group = 'Symbols', inline = 's15')
s16 = input.symbol('TJX', group = 'Symbols', inline = 's16')
s17 = input.symbol('TMUS', group = 'Symbols', inline = 's17')
s18 = input.symbol('TSLA', group = 'Symbols', inline = 's18')
s19 = input.symbol('TWTR', group = 'Symbols', inline = 's19')
s20 = input.symbol('TXN', group = 'Symbols', inline = 's20')
s21 = input.symbol('UAL', group = 'Symbols', inline = 's21')
s22 = input.symbol('UNH', group = 'Symbols', inline = 's22')
s23 = input.symbol('V', group = 'Symbols', inline = 's23')
s24 = input.symbol('VIAC', group = 'Symbols', inline = 's24')
s25 = input.symbol('WBA', group = 'Symbols', inline = 's25')
s26 = input.symbol('WFC', group = 'Symbols', inline = 's26')
s27 = input.symbol('WMT', group = 'Symbols', inline = 's27')
s28 = input.symbol('WYNN', group = 'Symbols', inline = 's28')
s29 = input.symbol('XOM', group = 'Symbols', inline = 's29')
s30 = input.symbol('SPY', group = 'Symbols', inline = 's30')
s31 = input.symbol('SPY', group = 'Symbols', inline = 's31')
s32 = input.symbol('SPY', group = 'Symbols', inline = 's32')
s33 = input.symbol('SPY', group = 'Symbols', inline = 's33')
s34 = input.symbol('SPY', group = 'Symbols', inline = 's34')
s35 = input.symbol('SPY', group = 'Symbols', inline = 's35')
s36 = input.symbol('SPY', group = 'Symbols', inline = 's36')
s37 = input.symbol('SPY', group = 'Symbols', inline = 's37')
s38 = input.symbol('SPY', group = 'Symbols', inline = 's38')
RSI true swingsRelative Strength Index (RSI) is being used by majority of the traders to get benefitted based on the swings. But these swings are hard to Identify.
This Indicator uses 4 major factors for finding the potential reversal points:
RSI Crossover or crossunder
Relative volume
Overall volume against the moving average volume
Relative closing of the candles
Size of the bars
Please read Instructions carefully before using this indicator
Recommended entry is the OHLC4 of the signal bars.
If signal bar is too large, try to enter in the retracement when another signal comes either through indicator or through types of bars
when signals comes opposite to the trend, then try to wait for the next signal of same type. This creates a RSI-price divergence in confirmation by volume price action
Timeframe can be of your choice
Recommended stoploss should be swing highs or lows

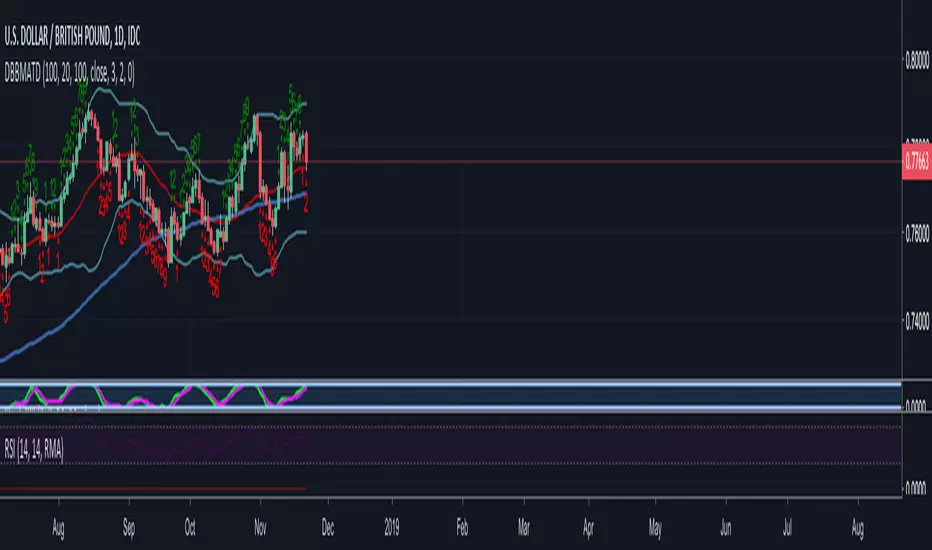
Relative strength DivergenceThe following indicator uses relative comparison of two assets by the formula n/s3, where n is the t asset on the screen while s3 the underlying assets it is being compared to. The usefulness of the indicator is to primarily compare the assets being traded like BTC (most prominent crypto with largest market cap), with some other crypto like TRX(this has a relatively smaller market cap). Since we get a broader market view through relative comparison of the two assets, the most important function is to find the edge through divergences. Just like RSI the divergences rules would be the same and most important trades would be trades in the direction of the trend along accompanies by divergences that are in line with the trend. Simple divergences work for the best trades with default settings. Although BTCUSD is the default asset to compare with it can be switched with any other asset as well, but it is very much preferred that one uses some type of index as the base asset for comparison. Other than that for simple trading the trend MA crossover can also be used as a signal for simple trend following.

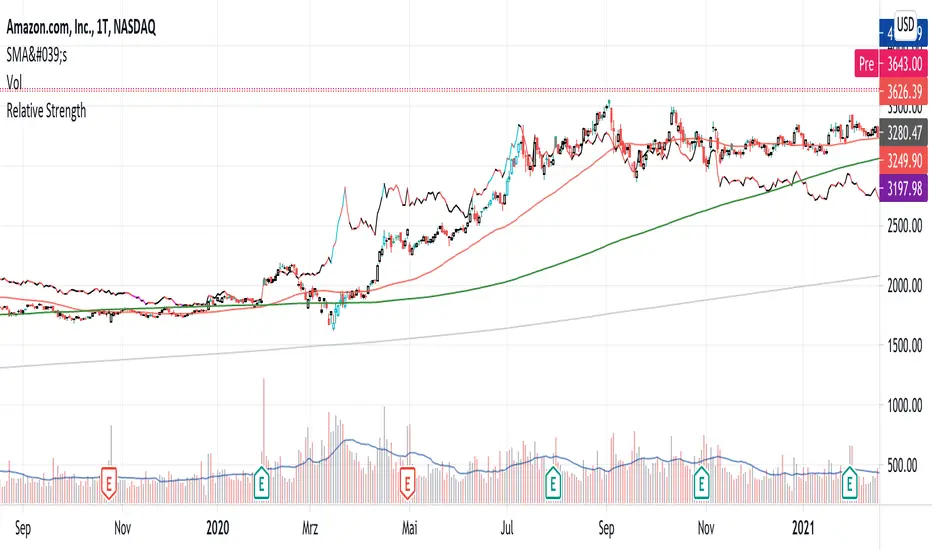
Relative StrengthPowerful tool to calculate and display the strength of a security compared to another security.
Some Main purposes are:
- finding new leadership in a market correction
- comparing a market leader with a top competitor
- tracking rotation in the market
.. and so much more!
This tool is highly configurable, you can especially change:
- The reference symbol (SPY, QQQ, BTCUSD, ...)
- The time span to indicate a new High or Low in a certain time-frame
- Factorize your RS-Chart to make it fit to the original chart. (Moves the chart up or down)
- Option to repaint your candles / bars when a new RS High occurs in the given timeframe.
Enjoy and have a great day!
Powerful_Trading
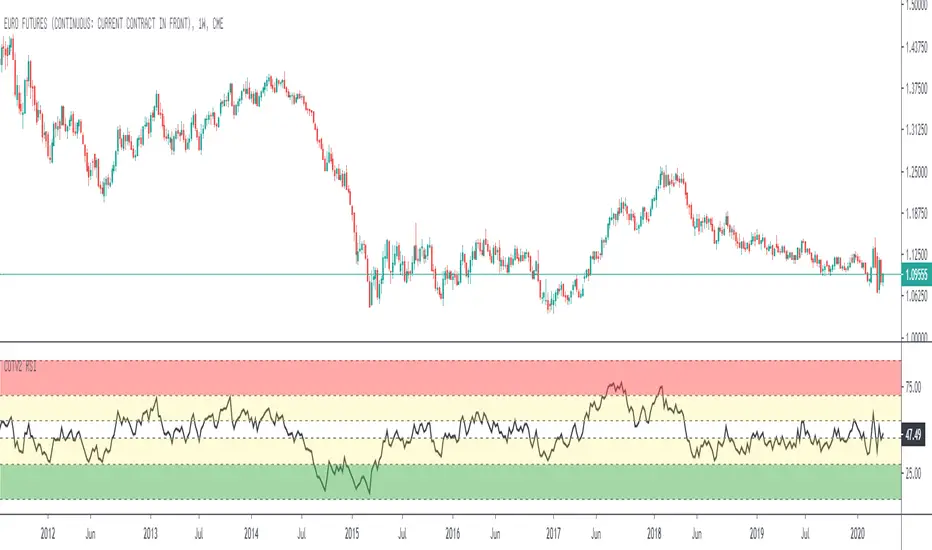
Relative Strength Index for COT System V2Standard Relative Strenght Indicator with coloured value areas. The red area shows a strong overbought level, what can be used as an warning signal for a trend reversal into downtrend.
The green area shows a strong oversold level, what can be used as an warning signal for a trend reversal into uptrend. The yellow areas are only warning areas.
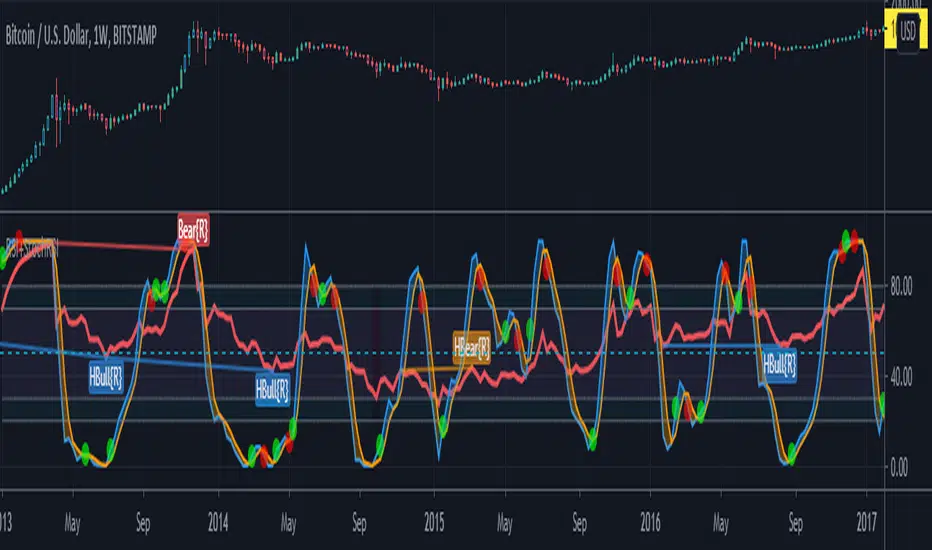
relative strength to BTCIt compares how much the asset has gone up or down in % more or less relative to BTC % increments.
It can also be converted into an oscillator

Relative Strength Index + DMI DivergencesHi guys I combine RSI and DMI in one study with alerts when price is Overbought, Oversold. Buy and sell divergences in the DMI and strength of the trend in the background I hope its useful for you as its to me

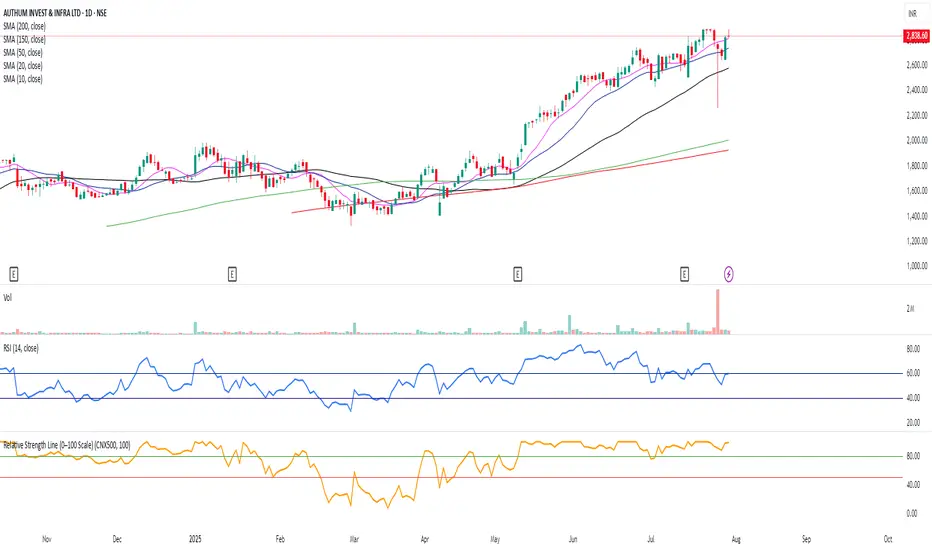
Relative Strength to MarketPlots the relative performance of a stock to a chosen market (default: SP500) as a sliding window average over three different time periods (50, 100 & 200 candles)

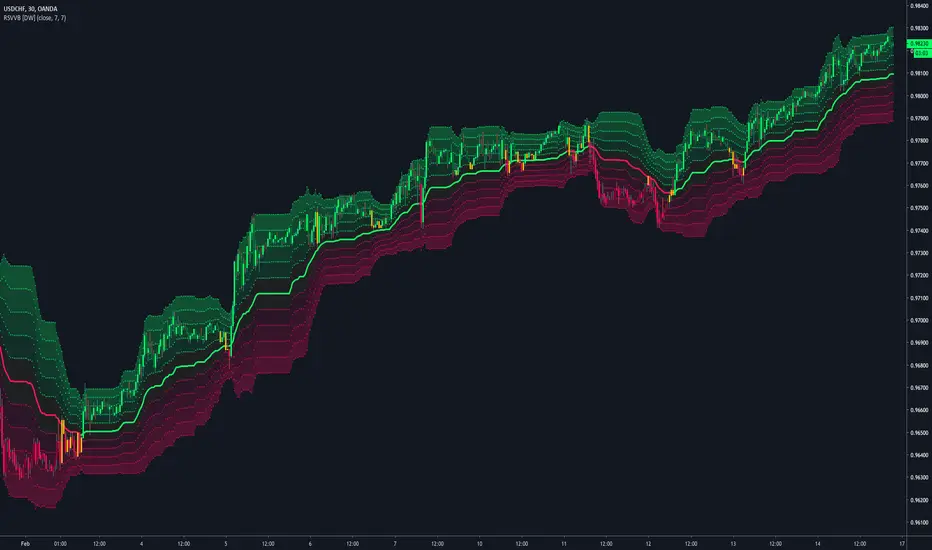
Relative Strength Volatility Variable Bands [DW]This is an experimental adaptive trend following study inspired by Giorgos Siligardos's Reverse Engineering RSI and Tushar S. Chande's Variable Moving Average.
In this study, reverse engineered RSI levels are calculated and used to generate a volatility index for VMA calculation.
First, price levels are calculated for when RSI will equal 70 and 30. The difference between the levels is taken and normalized to create the volatility index.
Next, an initial VMA is calculated using the created volatility index. The moving average is an exponential calculation that adjusts the sampling length as volatility changes.
Then, upper and lower VMAs are calculated by taking a VMA of prices above and below the initial VMA. The midline is produced by taking the median of the upper and lower VMAs.
Lastly, the band levels are calculated by multiplying the distance from the midline to the upper and lower VMAs by 1, 2, 3, 4, and 5.
Bar colors are included. They're based on the midline trend and price action relative to the upper and lower VMAs.

Relative StrengthCompare the strength of the current stock to a benchmark (default SPX).
Includes a SMA (default 13 weeks/3 months).
Best used on the weekly time frame.

Relative Strength Index ExponentialRelative Strenght Index not measured with the standard exponentional weighted moving average (RMA) But with the standard EMA. Giving sharper spikes.

Relative Strength Index Direction by Nico MuselleThe relative strenght index (RSI) is an oscillator generally used to detect overbought and oversold conditions which indicate a market could reverse.
In this case however, we are using it as a directional indicator , using the 50 level as a judge of whether we need to look for long entries or short entries. I have added an optional EMA which could be used for timing the entries or exits . By default the indicator will color the bars in the same color as the RSI, but you can just toggle it in the settings to switch this off.
Let me know how you use this indicator and if you find this specific "directional" version useful. Help others finding this indicator by posting a link to this script in your publications and share your success stories.
Likes, shares, comments and suggestions are of course appreciated ! Let me know what you think !


Relative Strength Index(RSI)- Range (60-40)Custom RSI Indicator:
The Custom RSI Indicator is a technical analysis tool designed to assess the momentum of a financial instrument's price movements within a specified range. Unlike the traditional RSI, which typically operates within a range of 0 to 100, this customized version focuses on a narrower spectrum between 40 and 60, providing clearer signals for traders.
Key Features:
Bullish and Bearish Zones: The indicator delineates between bullish and bearish sentiment. When the RSI value climbs above 60, it signals bullish momentum, indicating potential uptrends in the price. Conversely, when the RSI dips below 40, it suggests bearish sentiment, signaling potential downtrends.
Overbought and Oversold Conditions: Additionally, the Custom RSI Indicator identifies extreme market conditions. When the RSI surpasses 80 , it denotes overbought territory, suggesting that the asset may be overvalued and prone to a reversal or correction. Conversely, when the RSI falls below 30 , it indicates oversold conditions, suggesting that the asset may be undervalued and ripe for a potential rebound.
Default RSI Comparison: The Custom RSI Indicator can be compared against the traditional RSI for added context. While the customized range provides more precise signals within the 60-40 spectrum, referencing the default RSI can offer broader insights into market dynamics.
Usage:
Trend Identification: Traders can utilize the Custom RSI Indicator to identify potential trend reversals or continuations based on shifts in momentum within the specified range.
Confirmation Tool: It can serve as a confirmation tool alongside other technical indicators or price action analysis, enhancing the overall reliability of trading decisions.
Risk Management: By recognizing overbought and oversold conditions, traders can implement risk management strategies such as setting stop-loss orders or adjusting position sizes to mitigate potential losses.
Conclusion:
The Custom RSI Indicator offers traders a focused perspective on market momentum within the 60-40 range, facilitating more accurate assessments of bullish and bearish sentiment as well as identifying extreme market conditions. By incorporating this tool into their analysis, traders can make informed decisions and potentially improve their trading outcomes.

Relative Strength Index ExEnhanced RSI with an additional SMA line plotted with default period of 12. The default period for RSI is set to 12 and the regular MA line period to 4.

Relative Strength ComparatorBasically just plots the RSI and the RSI of another stock you pick. Then subtracts the two and makes a histogram showing who's winning.
Relative Strength Index by MI7TOP LINE : SELL
BOTTOM : BUY
RED LINE unbelievable SELL OR BUY
YELLOW LINE excellent SELL OR BUY
Green Line good SELL OR BUY